To succeed in day trading and capture short-term price movements traders need strategies to help identify high-probability entry and exit points. An important skill is to be able to identify support and resistance levels, combined with candlestick patterns. By analyzing 5-minute and 15-minute candlestick charts, traders can identify opportunities to profit from market volatility.
In this blog post, we’ll break down how to identify support and resistance levels, read candlestick patterns, and use these tools effectively for day trading.
What Are Support and Resistance Levels?
A support level is a price where buying pressure tends to prevent the price from falling further. It acts as a “floor” that the price struggles to break below. This support level is due to buyers entering the trade whenever the price dips. A breakout below this support level is a bearish signal indicating the potential for the price to continue falling.
A resistance level is a price where selling pressure tends to prevent the price from rising further. It acts as a “ceiling” that the price struggles to break above. This resistance level is due to sellers exiting the trade whenever the price rises. A breakout above this resistance level is a bullish signal indicating the potential for the price to continue rising.
Day traders tend to use 5 and 15-minute charts over a day or week to identify support and resistance levels.
How to Identify Support and Resistance
- Previous Price Levels
- Look for areas on the chart where the price has reversed multiple times in the past.
- These levels are more reliable when they appear on both the 5-minute and 15-minute charts.
- Round Numbers
- Stocks often find support or resistance near round numbers (e.g., $50, $100).
- Moving Averages
- Common moving averages, like the 20- or 50-period average, can act as dynamic support and resistance levels.
- Volume Spikes
- High trading volume at specific price levels indicates strong support or resistance.
Candlestick Patterns: The Key to Understanding Price Action
Candlestick patterns provide valuable insight into market sentiment and potential price reversals. Here’s how to read them:
1. Anatomy of a Candlestick
- Body: The area between the open and close prices.
- A green (or white) body indicates a bullish candle (price closed higher than it opened).
- A red (or black) body indicates a bearish candle (price closed lower than it opened).
- Wicks (Shadows): The thin lines above and below the body show the price's high and low during the period.
- Close Above Open: Bullish sentiment.
- Close Below Open: Bearish sentiment.
2. Key Candlestick Patterns for Day Trading
- Doji:
- Appears when the open and close prices are nearly equal.
- Indicates indecision in the market and potential reversals.

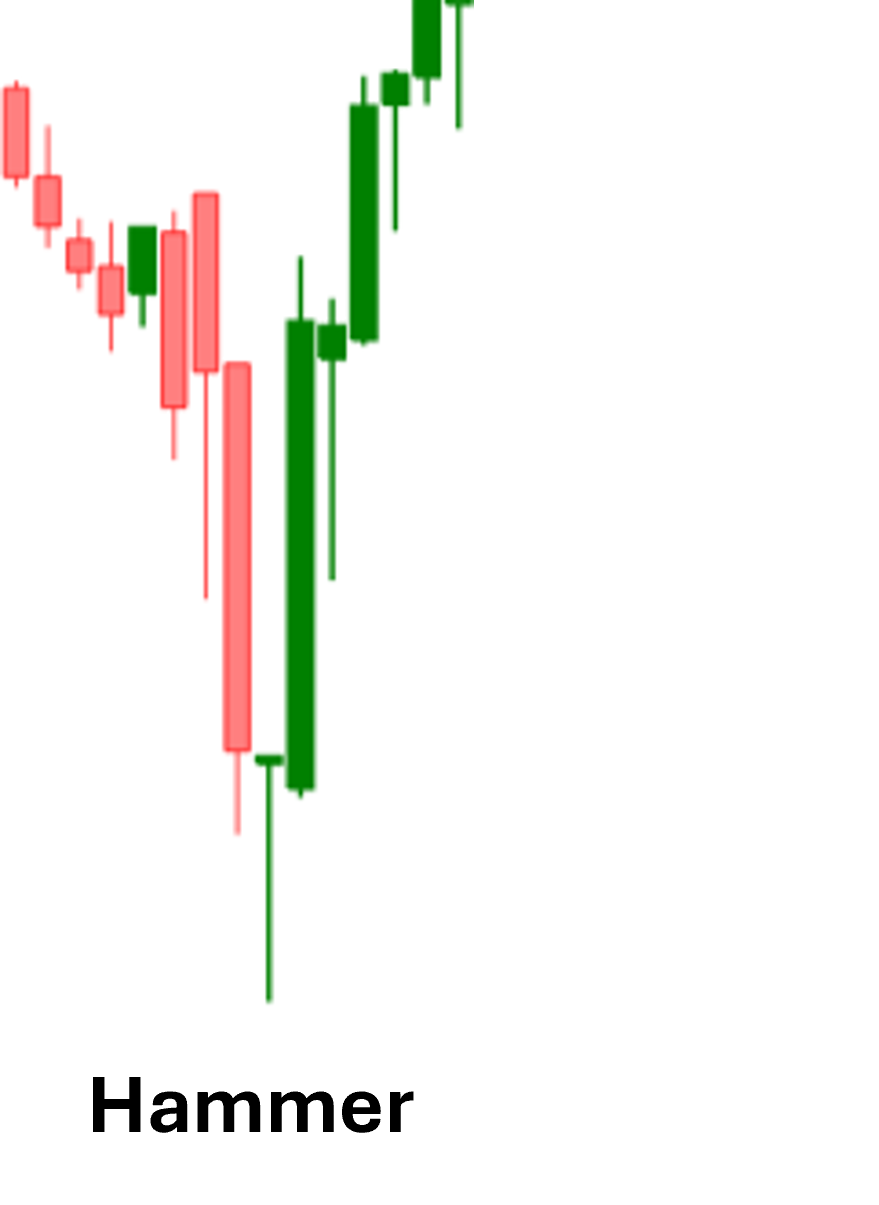
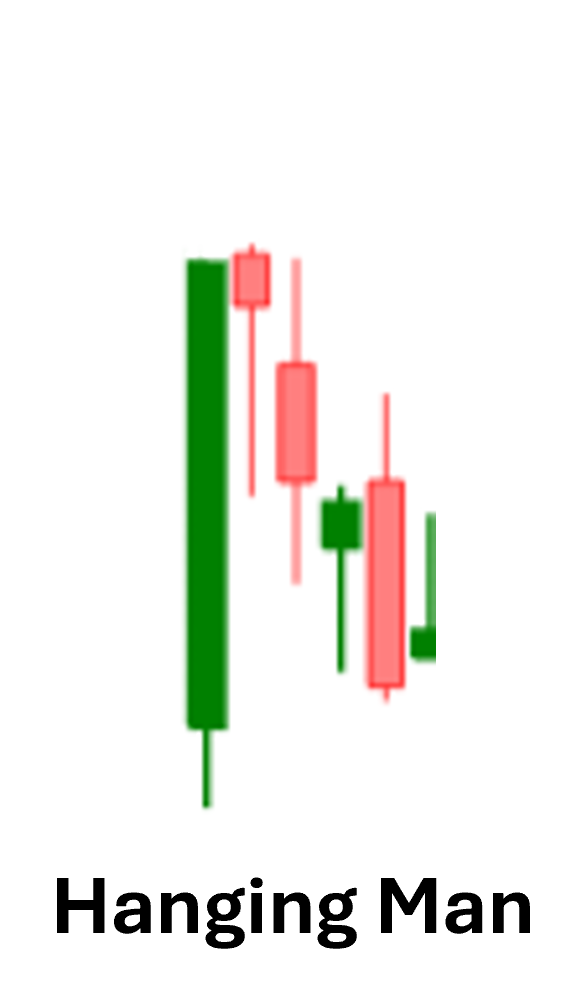
- Hammer and Hanging Man:
- Hammer: A small body near the top of the candle and a long lower wick. Appears at support levels and signals potential bullish reversal.
- Hanging Man: Similar to a hammer but appears at resistance levels and signals potential bearish reversal.
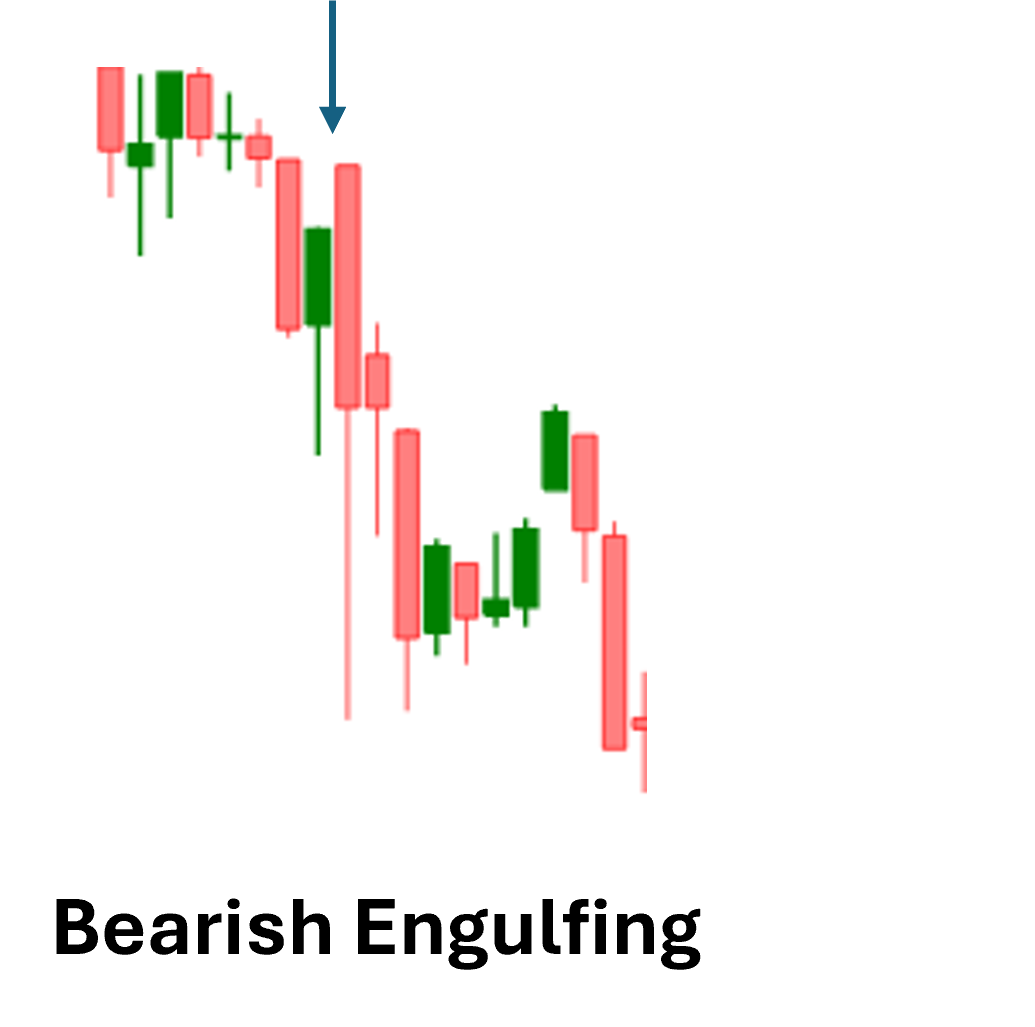
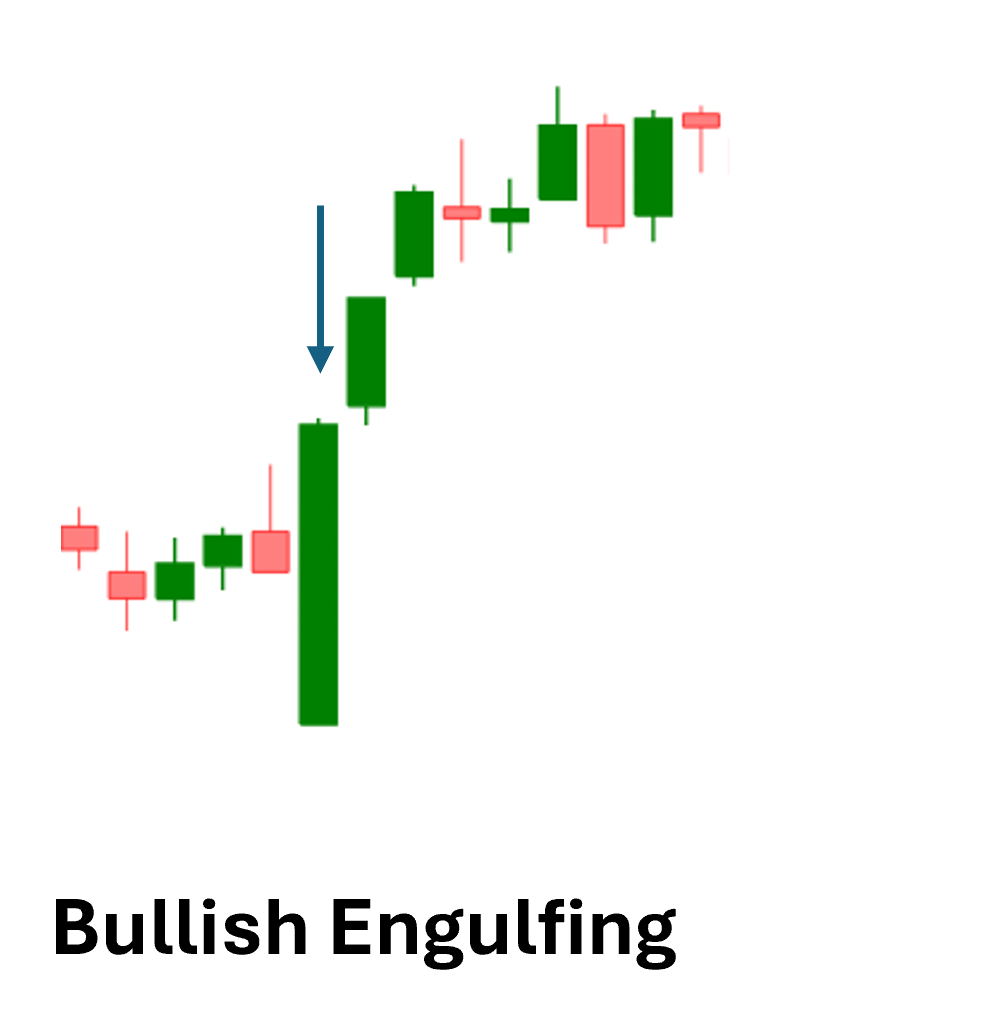
- Engulfing Patterns:
- Bullish Engulfing: A green candle fully engulfs the previous red candle, signaling a reversal to the upside.
- Bearish Engulfing: A red candle fully engulfs the previous green candle, signaling a reversal to the downside.
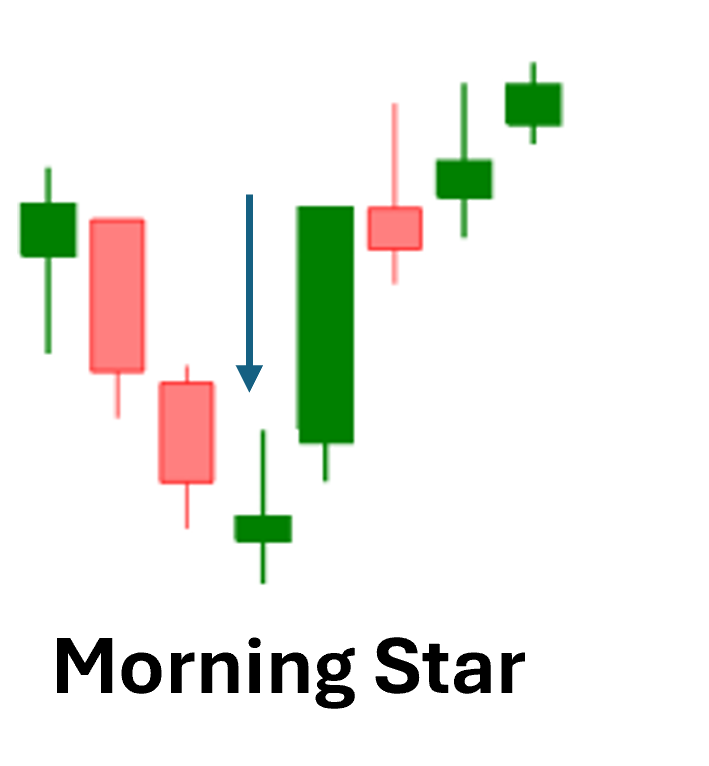
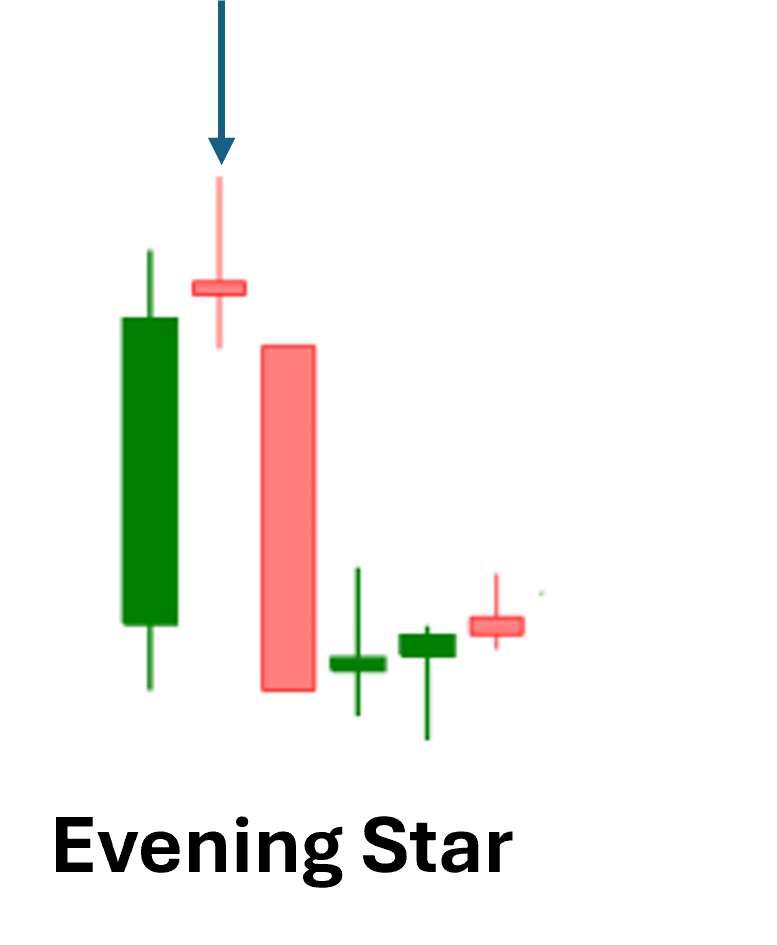
- Morning Star and Evening Star:
- Morning Star: A three-candle pattern signaling bullish reversal after a downtrend.
- Evening Star: A three-candle pattern signaling bearish reversal after an uptrend.
Using 5-Minute and 15-Minute Charts
Day traders commonly use 5-minute and 15-minute charts for a detailed view of intraday price action. Here's how to leverage these timeframes:
1. 5-Minute Charts
- Best For: Precision and short-term trades.
- Usage: Use the 5-minute chart to fine-tune entries and exits.
- Key Tips:
- Identify candlestick patterns near support and resistance levels for potential trades.
- Monitor the price reaction at these levels to confirm strength or weakness.
2. 15-Minute Charts
- Best For: Bigger picture and confirmation.
- Usage: Use the 15-minute chart to identify broader trends and validate support/resistance levels spotted on the 5-minute chart.
- Key Tips:
- Look for alignment between levels and patterns across both timeframes for higher confidence trades.
- Use the 15-minute chart to spot stronger patterns, like engulfing or morning star formations.
Combining Support, Resistance, and Candlesticks in Day Trading
Here’s a step-by-step guide to integrating these tools into your day trading strategy:
- Identify Key Levels Before the Market Opens
- Use pre-market data and the previous day’s chart to mark support and resistance levels.
- Watch for Price Action at Key Levels
- Monitor how the price behaves near these levels. Look for candlestick patterns to confirm whether the level will hold or break.
- Enter Trades Based on Confirmation
- At support: Look for bullish patterns like hammers or bullish engulfing candles.
- At resistance: Look for bearish patterns like hanging man or bearish engulfing candles.
- Use Moving Averages for Dynamic Support and Resistance
- If the price bounces off a moving average, it could provide an additional layer of confirmation.
- Set Tight Stop-Losses and Clear Targets
- Place stop-loss orders just beyond support or resistance levels.
- Use risk-reward ratios (e.g., 1:2) to set profit targets.
Practical Example: A Day Trade Using the 5-Minute Chart
- Scenario: A stock is trading near a support level of $50, identified from pre-market data.
- Observation: On the 5-minute chart, a hammer candle forms at $50, signaling potential bullish reversal.
- Confirmation: The next candle is green, closing above the hammer’s high.
- Action: Enter a long trade at $50.20 with a stop-loss at $49.80 and a profit target of $51.
Tips for Success
- Combine Tools: Use candlestick patterns as confirmation for trades near support and resistance.
- Watch the Volume: Higher volume during pattern formation strengthens the signal.
- Avoid Overtrading: Not every pattern near a key level will lead to a profitable trade. Wait for confirmation.
- Stay Disciplined: Stick to your strategy and exit rules to manage risk effectively.
Conclusion
Support, resistance, and candlestick patterns are foundational tools for day traders. By mastering how to identify key levels and read patterns on 5-minute and 15-minute charts, you can improve your ability to spot opportunities and execute trades with confidence.
Day trading requires patience, discipline, and constant learning. Practice analyzing charts and refining your approach to develop a strategy that works for you. As you gain experience, these techniques will become second nature, helping you navigate the fast-paced world of day trading effectively.
Thanks